Wednesday, June 27, 2012

Putting everything together: Gas Sensors: Part I

I chose to first wire up all the gas sensors, as they have been heated for a while, and the code for reading out their values is simple. (I'm just reading out a "raw" number between 0 and 1023 that corresponds to the range of 0-5V. It has nothing to do w/ ppm.)

The setup looks like this: (look at that wire forest!)


The gas sensors are wired in parallel. Nothing has changed in the individual wiring of each sensor. They just link to a common ground and power source (except the CO sensor - it gets its own power from pin 11). The code I used reads out all the "raw" numbers for each of the sensors, and also monitors the PWM wave for the CO sensor. 

The numbers on each sensor are all fairly consistent. After repeated runs, I got these numbers:

CH4: 250
LPG: 9
CO: 320
H2: 116

The only problem is that the sensor's don't seem to respond at all to changing gas levels.... I've checked my connections twice already, but there doesn't seem to be a mistake. So I'm assuming it has something to do with either my code or a bad connection. I suspect it might be a connection issue, actually, because the H2 sensor and the LPG sensor are both really hot, while the other two sensors are ice cold (as if I didn't even plug them in). Interestingly, while "burning in" the H2 sensor, the sensor was ice cold. But the power source I used to burn the sensors in displayed that the H2 sensor had a current... So I'm not sure what the temperature means in terms of connections. 

All 4 sensors together use a total current of 0.43 A max at 5.0 V. 

Tuesday, June 26, 2012

Optical Dust Sensor

This is the trickiest sensor I've had to work with so far.

Prior to attaching anything, I needed to solder wires to crimp pins, attach these wires to a connector, and attach the connector to the sensor.


The picture above is of the crimp pins (top) and the wire with a crimp pin attached to the end of it. I'm not sure you actually have to solder anything, but it definitely makes the connection a lot stronger. 


After soldering all the wires and crimp pins together, I put everything in the connector, and then attached the connector to the device, as shown in the picture above. The problem is that since everything is so tiny, it was really hard to measure the resistance to make sure that I really had the wires connected. The connector also seemed like it was a lot of trouble, as the slightest touch of a wire could sever the connection. I'm hoping we can order some pre-made connectors with wires soon, because the data taken currently might not be reliable. 

The connection looks like this: (note that on the picture on the left, I removed the capacitor, which goes from the brown wire to ground, for easier viewing)
 

I got a lot of help with the connections from this site

Initially, we did not have a load resistor (the resistor to the right in the picture). The values we read out from the sensor kept fluctuating wildly. After putting in a 10K load resistor, the values seemed to stabilize but were ridiculously high (933). We increased the resistance to 27K ohms and the values dropped to 0, which is reasonable as there shouldn't be very much dust in the air. (I'm assuming that the sensor isn't that sensitive). 

Once again, we used our trusty sponge+soldering iron test to see if the smoke from the sponge would be detected by the sensor. Values seemed to spike to ~800 while the smoke was flowing through the aperture of the sensor, and quickly dropped back to 0 after we removed the source. Perfect. We just have to be careful to not bump this sensor as the connections are still very weak... 

Current usage: The theoretical maximum is apparently 20 mA... I measured .93 mA... ?

Monday, June 25, 2012

Geiger Counter / Project Box Ideas?

Geiger Counter

Dr. Bunn sent me some code written by a previous student whom he had worked with. It's code for getting data from a Geiger Counter (specifically, this one). Since Caltech students are awesome, her code worked perfectly fine one the first try when I hooked everything up =]. There's also a switch on the circuit board of the Geiger Counter. I'm assuming it's like an emergency off switch, as some elements on the circuit board are operating at a high voltage (I was stupid enough to pick up the board when it was operating and experienced the shock first hand).

^Geiger counter image from Sparkfun. 

Unfortunately the Fritzing library doesn't have a geiger counter part. But here's the setup: 


The pins aren't labeled when you make a custom part... But you can see their labels in the picture from Sparkfun. 
Pin 1 = 5V (to 5V on Arduino)
Pin 2 = GND (to GND on Arduino)
Pin 3 = OUT (to digital pin 2 on Arduino) 
The rest of the pins are not connected. 

The most important part of the code is the count/s, but there's a lot of additional information in the code as well. 

Current usage: 0.03 A

Project Box Ideas?

As I'm pretty much done with testing all the sensors (all that remains are the Optical Dust Sensor, the microphone (which we're not sure about how to get it to work yet...) and an accelerometer), it's time to start thinking about how to make the enclosure. Dr. Bunn and I agreed, after looking at a few project boxes, that I would machine the project box from scratch. This way, we can customize pretty much everything - fans, holes for power sources/USBs, specific mounting patterns for the sensors, etc. We're thinking of heading down to the Machine Shop tomorrow to see what materials there are and to see if we can get any tips on machining.

Friday, June 22, 2012

Gas Sensors

The gas sensors are a bit more tricky to connect. We have four gas sensors currently: MQ-4 (CH4), MQ-6 (LPG - butane, propane, etc), MQ-7 (CO), MQ-8 (H2 gas). Some other sensors (ozone, CO2, etc) might be ordered later.

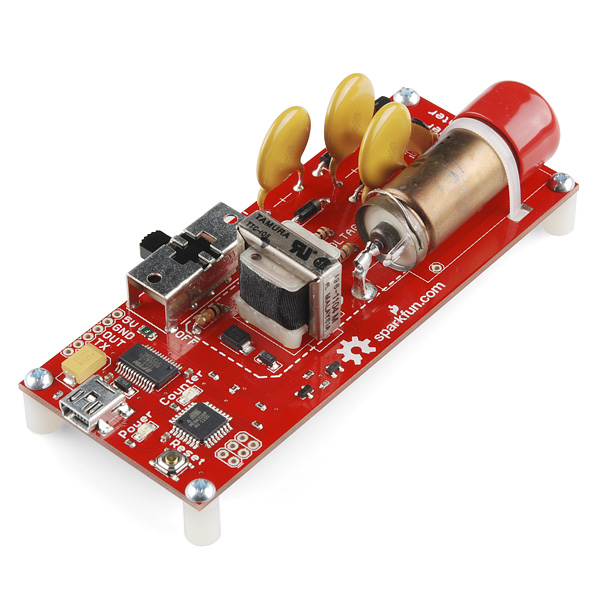
All the sensors are mounted onto little breakout boards that look like the one in the picture below. I've soldered wires to the breakout board to make it easier to connect things to the breadboard.


The sensors all have 6 pins that go into the holes on the breakout board. The breakout board is also labeled, with the 4 wires connecting to H1 (heating element), A1, B1 (data), and GND (ground). For all the breakout boards, I've connected the red wire to H1, blue wire to B1, white to A1, and brown to ground. 

The gas sensors were the hardest to connect, as the data sheet was a bit confusing. We at first connected the B1 and A1 together before realizing that one of them had to be connected to H1 and the voltage supply, while the other had to be connected to data output. 


MQ-4, MQ-6, and MQ-8

The MQ-4, MQ-6, and MQ-8 are all connected the same way: 

 Here's what the actual connection looks like:


My phone just has terrible picture quality.......

You can see the tip of a cigarette lighter on the top of the picture, which we used to test the LPG sensor for butane detection (bit sketchy). The value would rise when the sensor detected the butane gas, but it seemed to drop very slowly, as if the gas was "trapped" in the sensor for a bit. We are thinking of putting a fan close to the sensors to prevent this from happening. The methane and hydrogen sensors aren't tested yet, as we don't really have access to those gases safely. However, they do show decent readings, seeming to imply that they work.


MQ-7

The MQ-7 (Carbon monoxide) sensor is the most complicated of the already complicated gas sensors. In addition to having to connect the blue and white (B1 and A1) leads correctly, it also requires an alternating 5V and 1.4V input created using PWM. I used code from the analogWrite() example to create a PWM wave. The MQ-7 is powered at 5V for 60 seconds, and 1.4V for 90 seconds in each cycle. 

Setup: 


To test the CO sensor, I... uh... burned a sponge with my soldering iron for a little bit, and then captured the fumes with the sensor. The value would rise sharply when CO was detected, but also drop sharply when we removed it from the source of the fumes, so it seems like this one will be the most responsive to rapid changes in the environment. 

Current draw for all sensors is roughly 170 mA. 

I'm leaving the sensors on a 5V power supply for two days to "burn" them in. Apparently, data sheets for the sensors suggest that if you burn them in for 24-48 hrs, they become more stable and accurate when measuring changing gas levels. 

***Edit 6/27/12:
During testing, I accidentally ignored the alternating current and just plugged the sensor into the 5V power source. I tested it again, this time powering the sensor with a alternating current outputted from pin 11 on the Arduino: 

Using the same method to test for CO detection revealed that the sensor responded less to changing CO levels. Room values was about 300. The smoke from the sponge (even when I put the detector very close to the sponge) made the values rise to only about 330. Of course, this is after the sensors "burned in" for two days. The values could have become more stabilized because of that. It could also be because the soldering iron (which I used to burn the sponge with) wasn't as hot since I needed to disconnect it from the power supply before testing (there was no other outlet I could use that was closer to my computer/Arduino set up. 

I asked Dr. Bunn whether we should keep using PWM for this sensor, and he suggested that for the time being, we just stick with 5V: 


Thursday, June 21, 2012

Sensors: Barometric Pressure and ... a faulty Microphone

Baometric Pressure Sensor

Setup:

The pins from left to right on the sensor's breakout board are: VCC (to 3v3), Ground (to Gnd on Arduino), EOC, XCLR (both of which we ignore for now), SCL (Serial Clock to A5), SDA (Serial Data to A4). The sensor can be found here

An important note is that this sensor needs to use the 3v3 (3.3 V) input. Putting 5V through it will fry the device. Using some sample code from the Quickstart Guide on the product page (which actually measures both Temperature and Pressure), I found that the temperature agrees roughly with the temperature read out from the temperature sensor. 

Room Temperature: 24.5 degrees C (the Temperature/Humidity sensor read out 24 degrees C)
Pressure: 98.4 kPa

The current draw is 60-70 mA.


Microphone

We had also ordered a microphone, but it didn't seem to be able to register anything when we plugged it in (AUD to Analog 0, GND to GND, VCC to 5V, with an 8.2k resistor between GND and AUD). Even if I clapped or tapped the microphone, nothing registered.

Wednesday, June 20, 2012

Sensors: Photocell and Temperature/Humidity Sensors

I'm testing out the sensors one-by-one for the first week (just to make sure they all work and can transmit/receive data when connected to the Arduino). The Arduino is connected to the computer by a USB cable. It's also where it draws the power (5V max).


Photocell:

Setup:


(Please excuse my terrible picture quality. Image on the left is created using Fritzing.)

The photocell is ordered from here: http://www.sparkfun.com/products/9088. Plugging the data input into the analog pin and running some code will theoretically display a value between 0 and 1023 on the computer screen. This represents voltage measured on a scale of 0V to 5V. In reality, however, if I cover the photocell, the value will drop to ~100, and if I shine a bright light on it, the value will jump to around 1000. Room value is around 870.

Current Usage: 250 mA with the 10K resistor.


Temperature/Humidity Sensor:

Setup:


The Temperature/Humidity Sensor is ordered from: http://www.sparkfun.com/products/10167. Its calibration is a bit complicated, so we used code from here to test the sensor.

Room Temperature: 24 degrees C.
Room Relative Humidity: 53%.

Current usage: 20 mA.


Humidity Sensor:
Setup:


We also ordered a humidity only sensor (http://www.sparkfun.com/products/9569). However, since humidity depends on temperature, we ended up just connecting both the humidity sensor and the temperature/humidity sensor onto the Arduino. The reading for humidity seemed to agree, which is good. It seems that it's just more efficient to use the temperature/humidity sensor, as this one doesn't seem to give us any additional information. 


The current usage seems negligible. It registered as 0 on the multimeter. 

Tuesday, June 19, 2012

Project Overview

ABOUT
I'm currently a rising Junior studying Mechanical Engineering at the California Institute of Technology. I am participating in a 10-week SURF (Summer Undergraduate Research Fellowship) Project in which I will build a prototype "Home Hazard Weather Station" in collaboration with Dr. Julian Bunn (Caltech's Center for Advanced Computing Research) and Professor Mani Chandy (Caltech's Computer Science Department). 

BACKGROUND
Environmental hazard detection (such as detection of fires, earthquakes, floods, and radiation leaks) is increasingly aided by computer sensors that transmit data to SaaS (Software-as-a-Service) Cloud computing systems, which allow for monitoring of conditions over large areas. However, precise sensors are expensive and very few in number, generally found only at facilities specifically interested in monitoring certain conditions. These sensors are incapable of producing detailed maps of conditions over large areas due to their small number, and therefore cannot serve as accurate and useful hazard detectors for large communities. We aim to produce detailed data for various environmental parameters over a large area by using a dense array of cheap sensors that relay information to Cloud resources in real-time. Studies have shown that by using a large number of relatively inaccurate sensors, coupled with a few precise sensors, we can greatly increase the accuracy of our sensor data over a given area and thus provide users with a reliable hazard detection system. Creative analysis of multiple types of sensor data will also allow us to monitor events otherwise not detectable with a single type of sensor. The finished product will be valuable not only to scientists who wish to monitor environmental conditions over time, but also to first-responders and product users in the case of an emergency.

OBJECTIVE
This project attempts to provide accurate, real-time data of various environmental parameters over a large area by using a number of relatively cheap sensors that serve as a “Hazard Weather Station”. This data will be made available to scientists, first responders, and the average user in order to create an efficient hazard response system.

This project builds off of the CSN (Community Seismic Network) project, which uses a dense array of inexpensive accelerometers to produce a “shake map” that monitors the seismic activity in and around Pasadena. These accelerometers are hosted in volunteers’ homes or offices, and, in addition to sending seismic data to the Cloud, allows the user to view seismic activity in their home or office via a computer application.

The goal is to construct a sensor hub (and associated software) with a variety of inexpensive sensors that can monitor other environmental parameters such as barometric pressure, radiation levels, temperature, air-quality, etc. In addition, the sensor hub will include a microphone, motion detector, and light sensor. This wide variety of sensors enable us to creatively fuse data from different sensors to detect events such as an approaching thunderstorm (finding a characteristic flash of lightning followed by rolling thunder), or a fire (changes in air quality coupled with decreased humidity). The sensors will be attached to the Arduino platform and transmit data at regular intervals to a Cloud based data storage infrastructure. The interval of transmission can be altered and prioritized for parameters that suddenly change in order to more accurately track anomalous environmental conditions. Data will be also displayed to users via a computer program and/or Android application.

By the end of the SURF research period, the prototype “Hazard Weather Station” will be able to relay information to a central Cloud computing system and work with a computer and/or Android application that lets users monitor changes in environmental parameters at their homes and offices.